Fig. 01 Aquafern — water log, iOS
Tanks rarely fail suddenly. They drift.
Aquafern records a full set of test results in about twenty seconds, then draws the line between them — which is where a slow drift actually becomes visible.

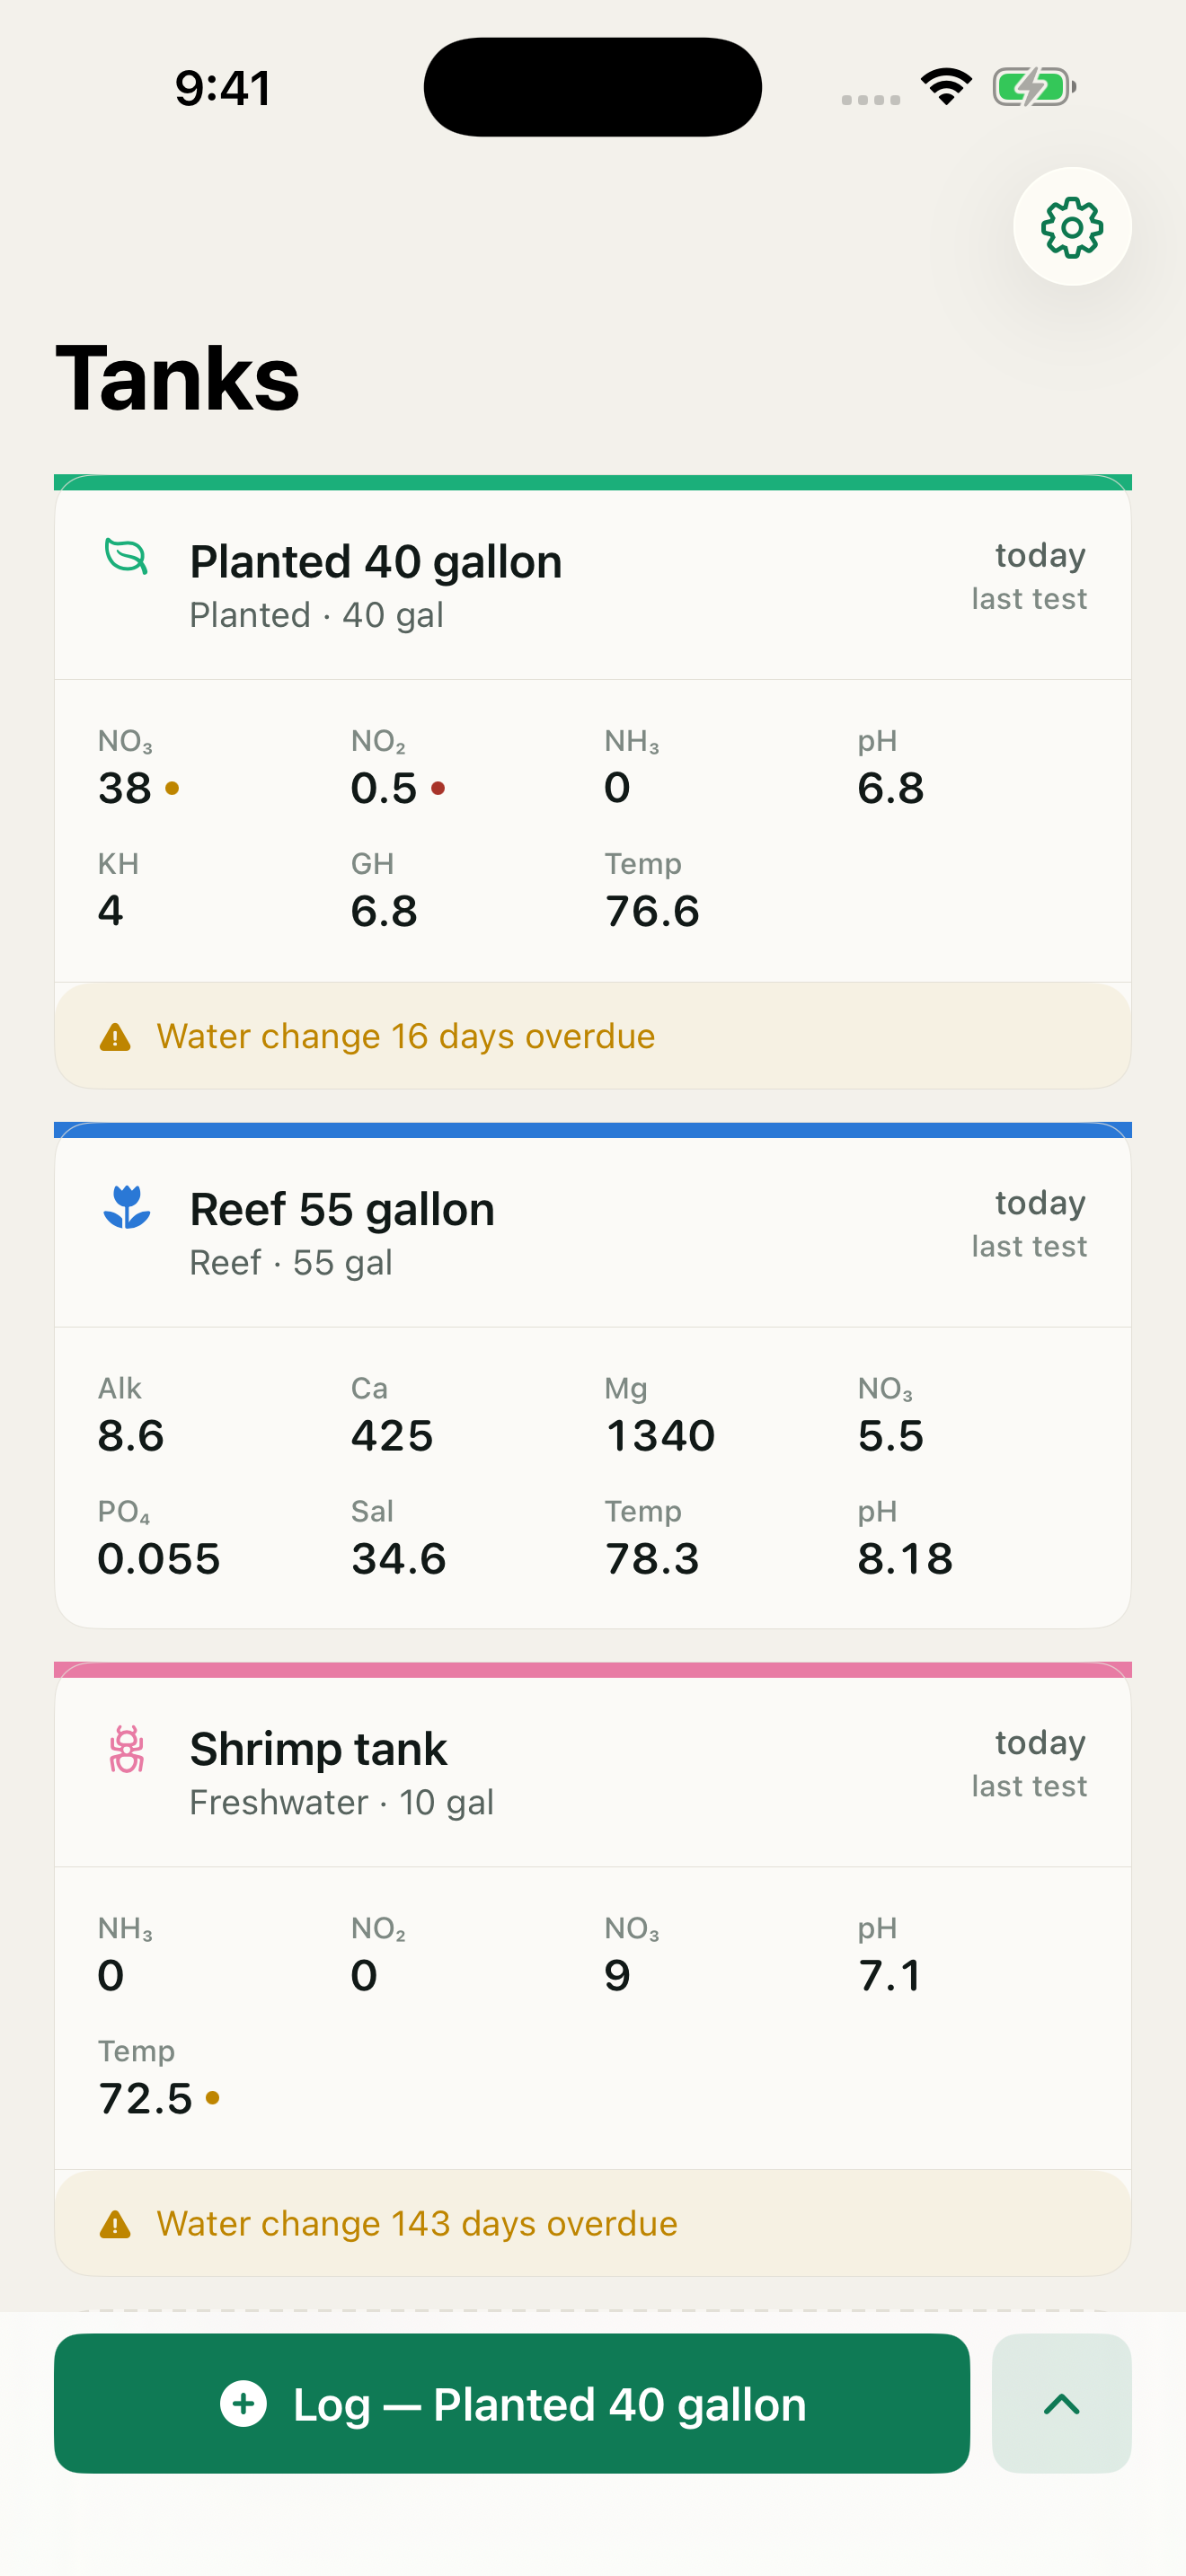
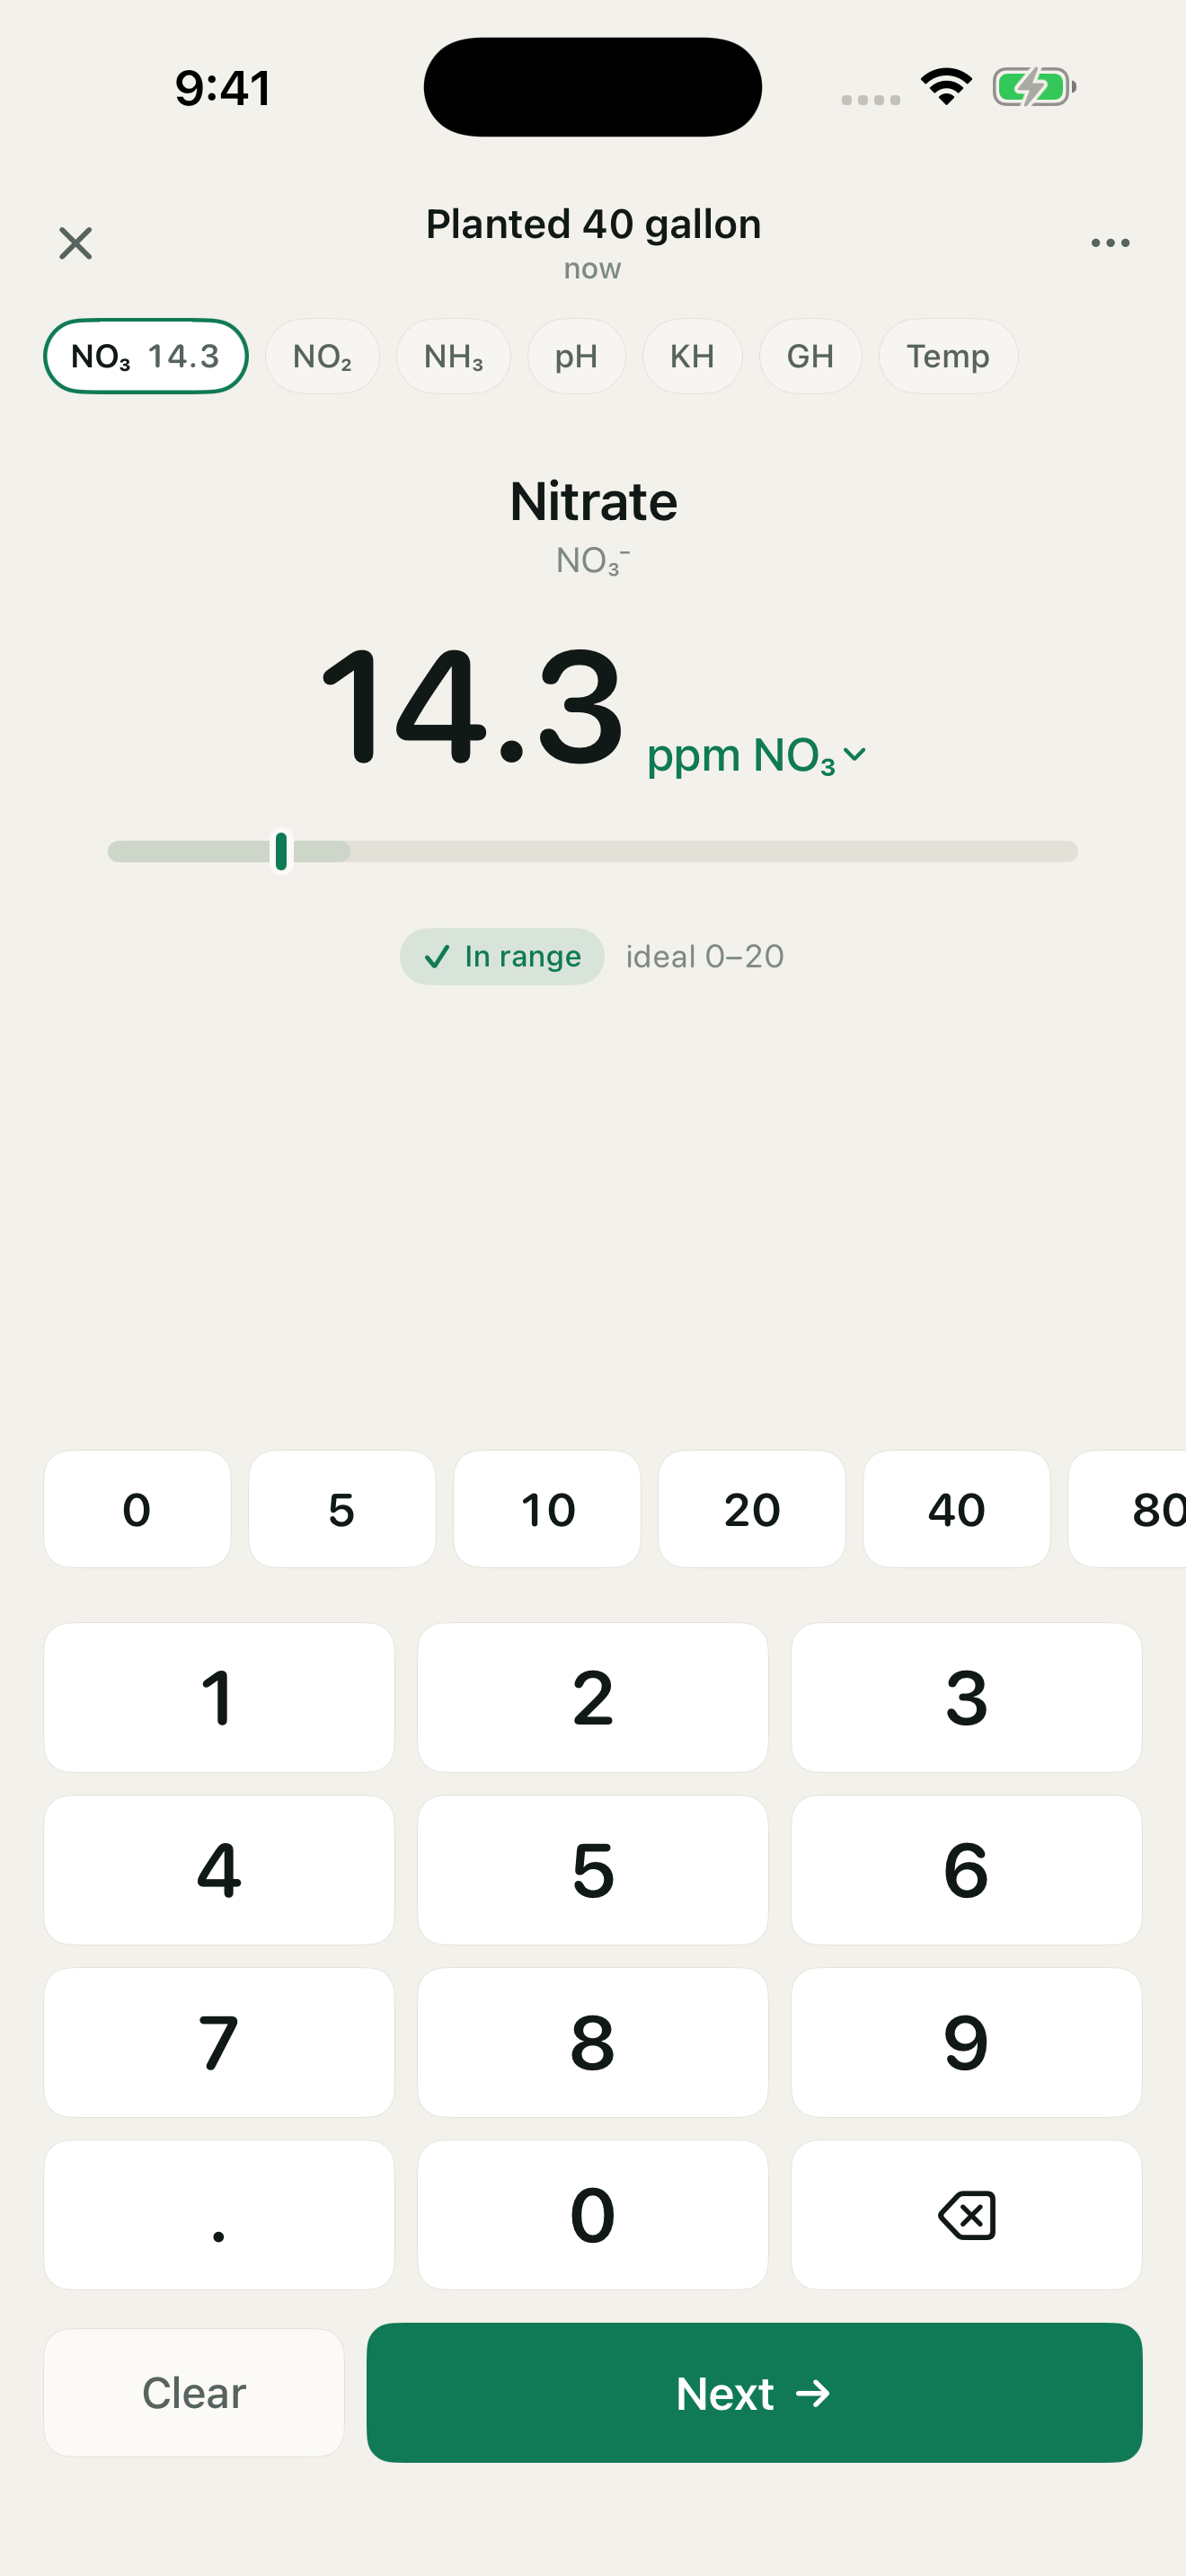
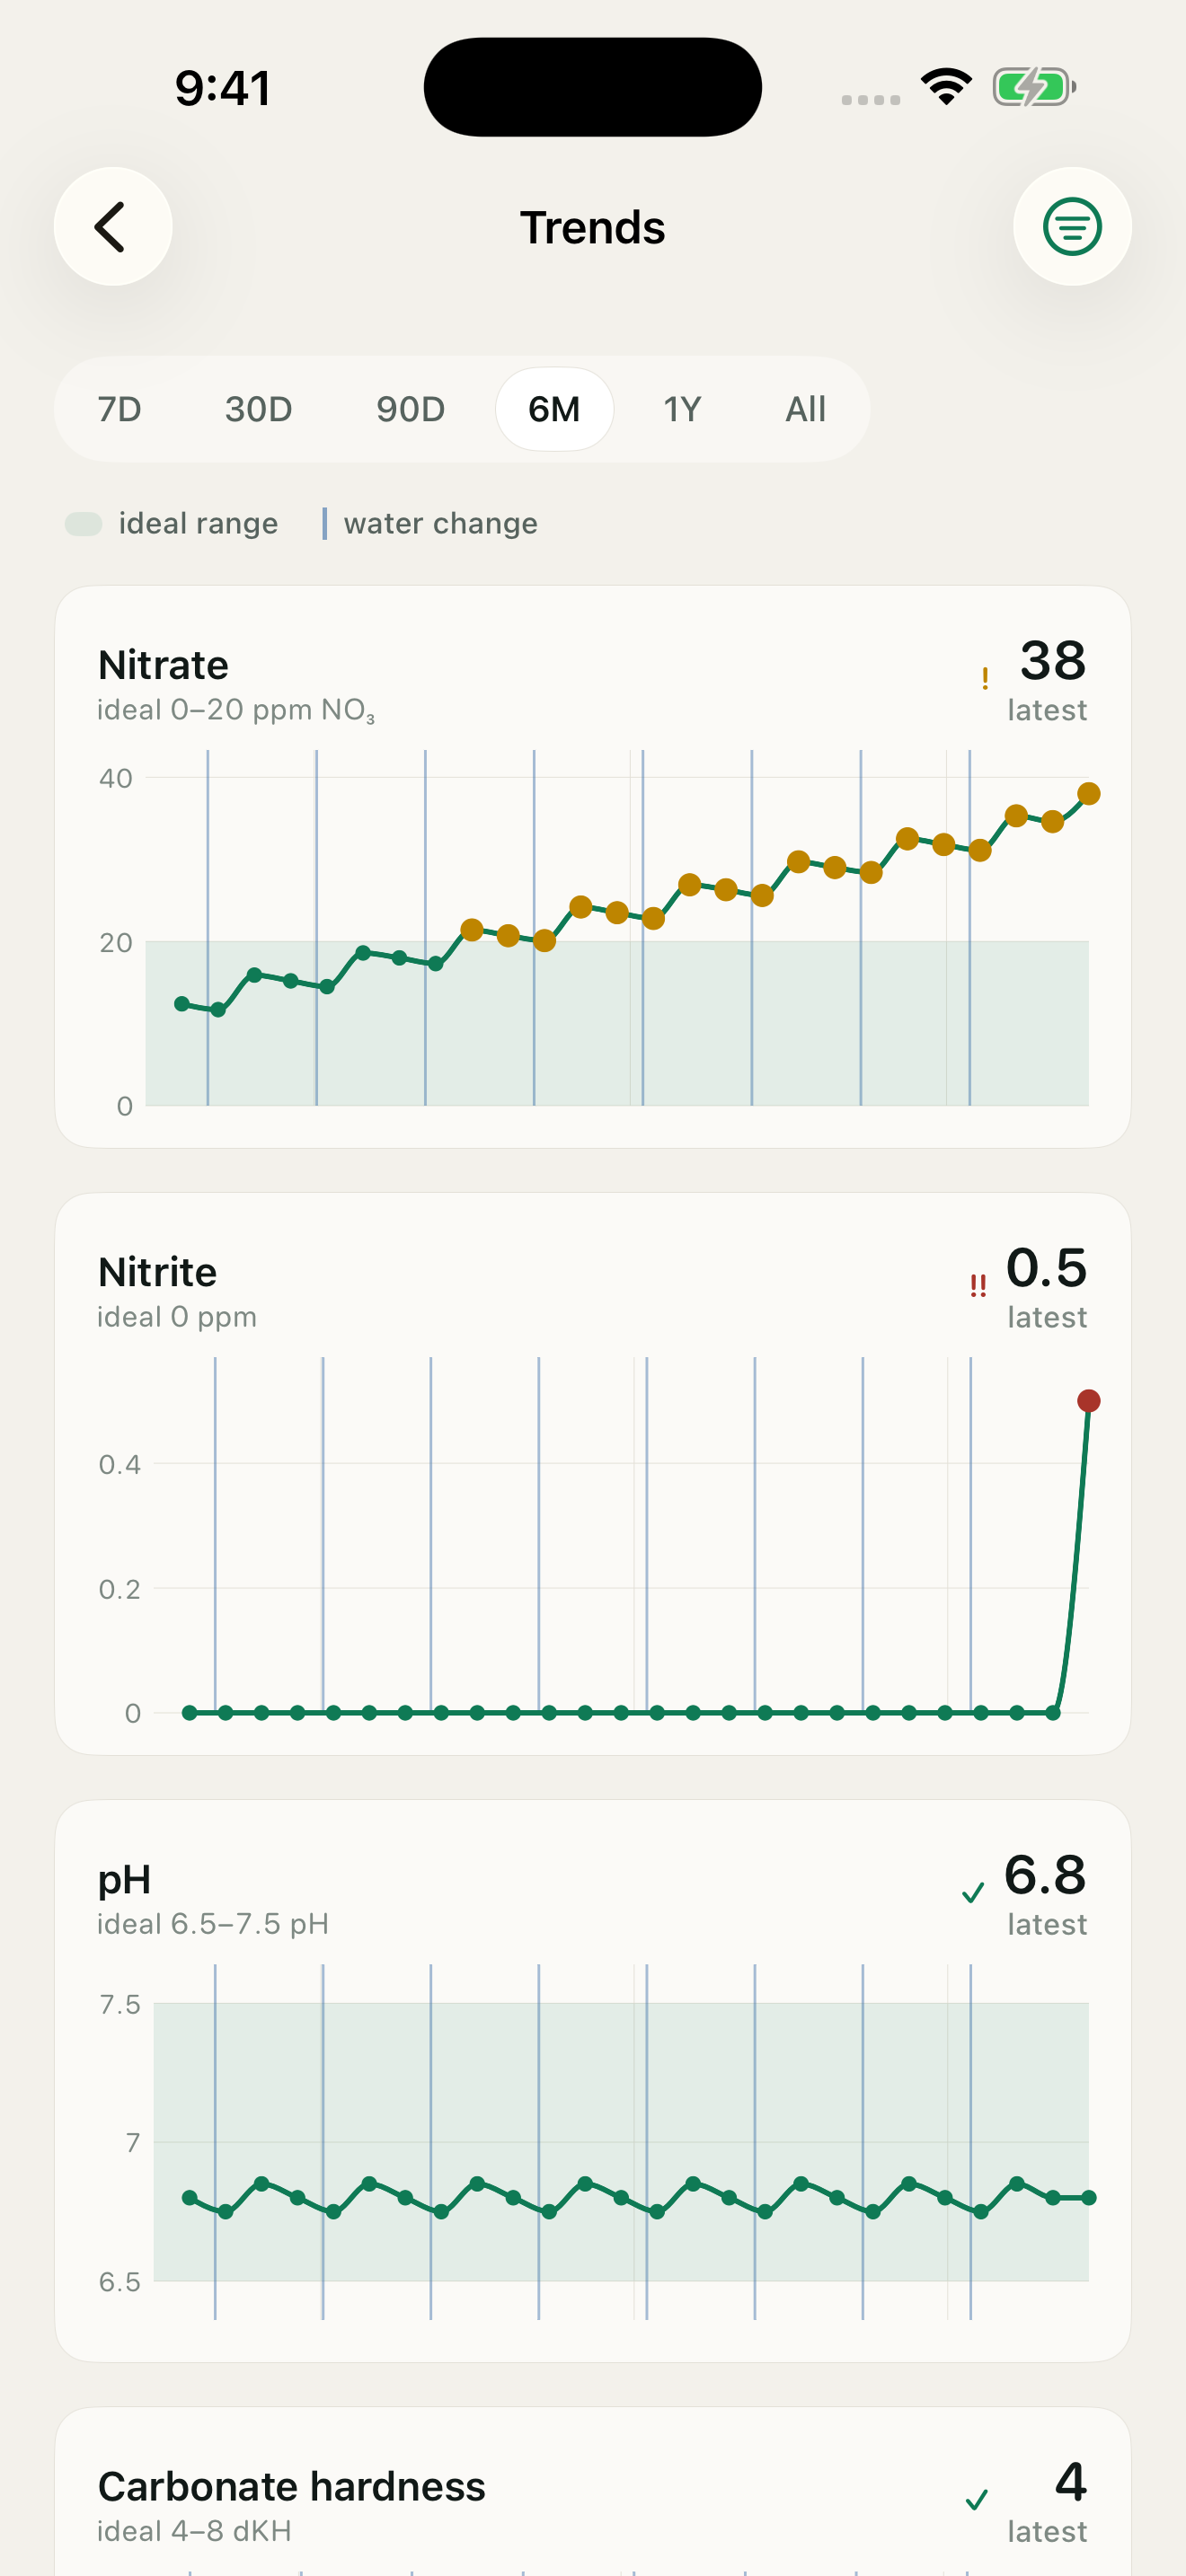
Fig. 02 Entry — measured in taps, not minutes
8Taps for a six-parameter freshwater test
Most water logs die in week three.
Almost always for the same reason: entering six numbers took too long while you were stood over a tank with a wet test vial in one hand.
So Aquafern shows one parameter at a time on a full screen, with a keypad about twice the height of the keyboard's. The order and the positions hold, so the muscle memory carries from the first log to the thousandth.
Then the actual trick. Ammonia, nitrite, nitrate and pH are read off a colour card that can only produce a fixed set of results — so Aquafern offers exactly those values as one-tap chips. No typing at all for most of a test. Probe-read parameters get a ±ladder around your last reading instead, because most barely move between tests.
Skipping a parameter records nothing, not zero. "Didn't test" and "tested and got zero" are different facts, and mixing them up would quietly corrupt every chart downstream.
Fig. 03 Trends — one facet per parameter, one shared timeline
Every parameter against its own ideal range.
pH lives between 6 and 8. Calcium lives between 380 and 450. Draw both on one shared scale and one of them is a flat line pinned to the edge of the chart — which is why Aquafern gives each parameter its own facet on a shared timeline instead of stacking them into one unreadable plot.
The shaded band behind each line is that parameter's ideal range for this tank's type. Readings outside it change colour and pick up a marker, so nothing depends on you noticing a shade of green.
Water changes are drawn straight through the stack. That's what turns "nitrate went down" into "nitrate went down because of Tuesday" — and a parameter that sat at a healthy constant all month collapses to a single line of text rather than spending a whole chart on nothing.
Fig. 04 Reference — shipped defaults, all editable
Eighteen parameters. Six tank types.
Pick a tank type and Aquafern sets up the right parameters with the right targets. These are the defaults it ships with — conservative middles drawn from mainstream hobby references, not one vendor's house numbers. Every one is yours to change per tank, because a discus keeper and a Tanganyikan keeper do not agree about pH and both are right.
| Parameter | Unit | Freshwater | Reef |
|---|---|---|---|
| Ammonia | ppm | 0 | 0 |
| Nitrite | ppm | 0 | 0 |
| Nitrate | ppm NO₃ | 0 – 20 | 2 – 10 |
| pH | — | 6.5 – 7.5 | 8.1 – 8.4 |
| Carbonate hardness | dKH | 4 – 8 | — |
| General hardness | dGH | 4 – 8 | — |
| Alkalinity | dKH | — | 8 – 9 |
| Calcium | ppm | — | 400 – 450 |
| Magnesium | ppm | — | 1300 – 1400 |
| Phosphate | ppm PO₄ | 0 – 1.0 | 0.03 – 0.08 |
| Salinity | ppt | — | 34 – 35 |
| Temperature | °C | 24 – 26 | 25 – 26.5 |
Fig. 05 Pricing — what each tier actually includes
Free for one tank.
Pro is about how many tanks you keep and how much of your history you can see at once. It is not about whether your data is safe — backup and sync are included on the free tier.
Fig. 06 Privacy — by architecture, not by policy
There is no server to leak anything.
Aquafern has no backend. Not a small one, not a private one — none. Your tanks and readings live on your device and sync through your own iCloud account. We never see them, and we haven't built anywhere to see them from.
In the app: no account, no password, no email address, no analytics SDK, no crash reporter, no advertising identifier, no tracking. Beyond Apple’s own iCloud and App Store, the only third party involved is the one that validates your subscription receipt — and it never receives a single water reading.
On this website: cookieless page-view analytics, so we know which pages get read. No cookies, no fingerprinting, nothing that follows you elsewhere — and entirely separate from the app. The detail is here.
Which also means your log survives not paying us. Cancel, and the charts shorten — nothing is deleted, nothing is held hostage. The full policy runs about four screens, because there isn't much to say.